
STATE INCOME
The State Domestic Product (SDP) and its related aggregates are the main components of Planning and Policymaking which are also considered important indicators of the development process of the State. The estimates of SDP reveal the extent and direction of changes in the levels of economic development of the State over a period of time. The fiscal reform measures adopted by the State of Assam started yielding favourable results since 2005-06 and have been recognized to be a key factor for attaining higher economic growth.
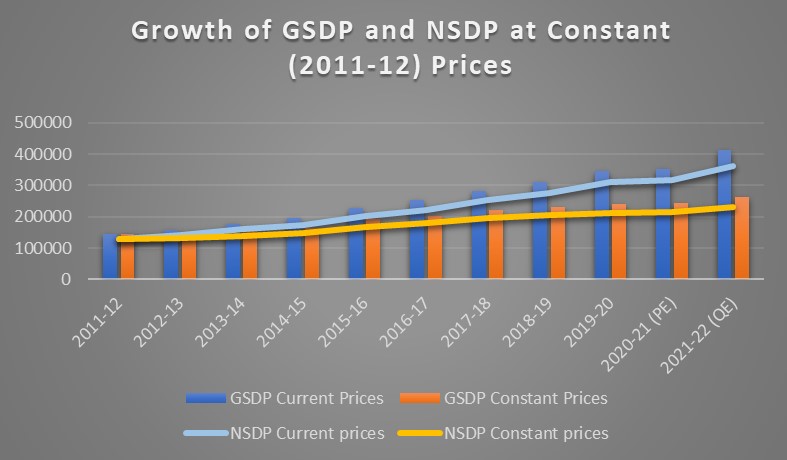
The annual average growth rate of the GSDP at current prices for the years 2012-13 to 2021-22 (QE) is 11.23 % and that of NSDP at the current prices for the same period is 11.0 %. In terms of the constant (2011-12) prices, the annual average growth rate of GSDP during the period 2012-13 to 2021-22 (QE) is estimated at 6.32 % and that of NSDP is at 6.07 %.
GSDP AND NSDP OF ASSAM FOR THE LAST DECADE
|
Year |
GSDP |
NSDP |
||
|
Current Prices |
Constant Prices |
Current prices |
Constant prices |
|
|
2011-12 |
143174.91 |
143174.91 |
129354.12 |
129354.12 |
|
2012-13 |
156864.24 |
147342.38 |
142039.46 |
132517.60 |
|
2013-14 |
177745.22 |
154525.40 |
160441.53 |
138726.76 |
|
2014-15 |
195723.00 |
165212.30 |
172848.89 |
146425.39 |
|
2015-16 |
227958.83 |
191109.00 |
201308.81 |
167628.67 |
|
2016-17 |
254382.00 |
202081.00 |
222396.52 |
179631.90 |
|
2017-18 |
283165.00 |
219919.00 |
253726.41 |
1995262.28 |
|
2018-19 |
309336.00 |
231040.00 |
276624.76 |
204627.05 |
|
2019-20 |
346851.00 |
240707.00 |
311031.49 |
212315.35 |
|
2020-21 (PE) |
353605.00 |
242946.00 |
315663.27 |
213871.31 |
|
2021-22 (QE) |
412612.00 |
262523.00 |
363160.86 |
231816.49 |
Estimates of GSDP and NSDP for the year 2021-22 (QE)
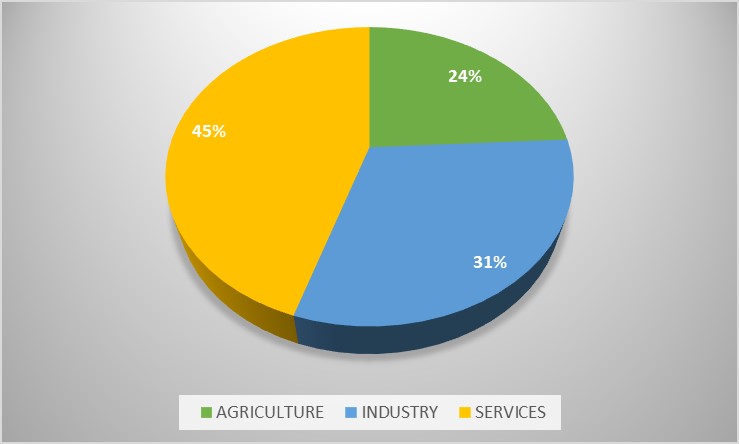
GSDP at constant (2011-12) prices for the year 2021-22 (Quick Estimates) is estimated at Rs. 2,62,523 Crore as against Rs. 2,42,946 crore for 2020-21 (Provisional Estimates) registering a growth of 8.10 %. The annual growth rate in respect of GSDP at constant price (2011-12) in Agriculture and its allied sector has declined from 8.47% in 2020-21 to 8.15% in 2021-22. The ‘Industry’ sector which comprises Mining & Quarrying, Manufacturing, Electricity, Gas, Water Supply & Other Utility Services, and Construction sectors is estimated at 8.08 % growth in 2021-22 (QE) as against (-) 1.70 % in 2020-21 (PE). The Services sector comprises Trade, Repair, Hotels & Restaurants, Transport, Storage, Communication & Services related to Broadcasting, Financial Services, Real Estate, Ownership of Dwelling & Professional Services, Public Administration, and Other Services, and its annual growth rate of GSDP at constant price (2011-12) is calculated at 7.77 % during 2021-22 (QE) as compared to (-) 4.12% in 2020-21 (PE).
SECTORAL CONTRIBUTION TO GSDP IN 2021-22 (QE) AT CONSTANT PRICE
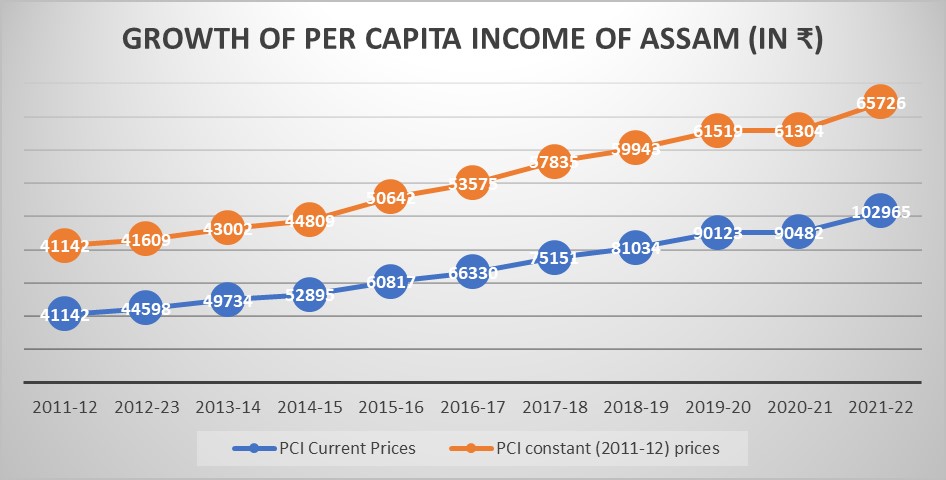
Estimates of Per capita Income for the year 2021-22 (QE)
The per capita income of the State in terms of NSDP at constant (2011-12) prices is estimated at Rs. 65726.00 for the year 2021-22 (QE). The same was Rs. 41142.00 in the year 2011-12 and Rs. 53575.00 in 2016-17. The average annual growth observed in the period 2011-12 to 2021-22 is 4.86 %. The per capita NSDP at current prices for the year 2021-22 and 2011-12 are Rs.102965.00 and Rs. 41142.00 respectively. The average growth rate of NSDP at current prices during this period is 10 %.
Gross State Domestic Product for 2021-22 (QE)
The Gross State Domestic Product (GSDP) of the State of Assam for the year 2021-22 (QE) at current prices was estimated at Rs. 4,12,612 Crore as against the Rs. 2,54,382 Crore in 2016-17 (Final estimates) with an average annual increase of 10.48%.
The Gross State Domestic Product at constant (2011-12) prices for 2021-22 was Rs. 2,62,523 Crore (QE) as against Rs. 2,02,081 crore in 2016-17 with an average annual growth rate of 5.50%.
Due to the COVID-19 outbreak all over the world as well as India, the provisional estimates of the Industry and Services sector were obtained to be lower than the previous year whereas the same for agriculture has increased. After that, the Quick Estimates of 2021-22 again show a steeply rising trend in GSVA for all the sectors signifying a V-shaped recovery path for the economy of the state. The following table shows the figures for the sectoral estimates from 2019-20 (Actual) to 2021-22 (QE).
Table: Sectoral Contribution and Rate of Growth
|
Sl. No |
Sectors |
2019-20 (Actual) |
2020-21(PE-II) |
2021-22(QE) |
|
1 |
Agriculture and Allied Sector |
39295.47 |
42625.63 |
46100.29 |
|
Growth rate |
- |
8.47 |
8.15 |
|
|
2 |
Industry Sector |
87662.41 |
86169.36 |
93132.14 |
|
Growth rate |
- |
-1.70 |
8.08 |
|
|
3 |
Services Sector |
92170.75 |
88354.15 |
95218.48 |
|
Growth rate |
- |
-4.14 |
7.77 |
| Title | Size | Detail |
|---|---|---|
| Gross State Domestic Product (Base 2011-12) at Current Price.pdf | 464.75 KB | |
| Gross State Domestic Product (Base 2011-12) at Constant price (2011-12).pdf | 397.7 KB | |
| Net State Domestic Product (Base 2011-12) at Constant price (2011-12).pdf | 396.55 KB | |
| GSDP at Factor Cost by Industry of Origin (Base Year 2004-05 at Constant Prices).pdf | 382.17 KB | |
| GSDP at Factor Cost by Industry of Origin (Base Year 2004-05 at Current Prices) (1).pdf | 384.26 KB | |
| NSDP at Factor Cost by Industry of Origin (Base Year 2004-05 at Current Prices).pdf | 383.12 KB | |
| NSDP at Factor Cost by Industry of Origin (Base Year 2004-05 at Constant Prices).pdf | 383.27 KB | |
| GSDP of all States - UTs of India at Constant Prices (Base Year 2004-05).pdf | 328.38 KB | |
| NSDP of all States - UTs of India at Current Prices (Base Year 2004-05).pdf | 326.91 KB | |
| GSDP of all States / UTs of India at Current Prices (Base Year 2004-05) | 326.44 KB | |
| Per Capita NSDP of all States - UTs of India at Constant Prices (Base Year 2004-05).pdf | 327.25 KB | |
| Per Capita NSDP of all States - UTs of India at Current Prices (Base Year 2004-05).pdf | 327.63 KB | |
| NSDP of all States / UTs of India at Constant Prices (Base Year 2004-05) | 326.82 KB | |
| Net State Domestic Product (Base 2011-12) at Current Price.pdf | 400.93 KB |
